
How to Use Tableau with Salesforce to Increase Sales
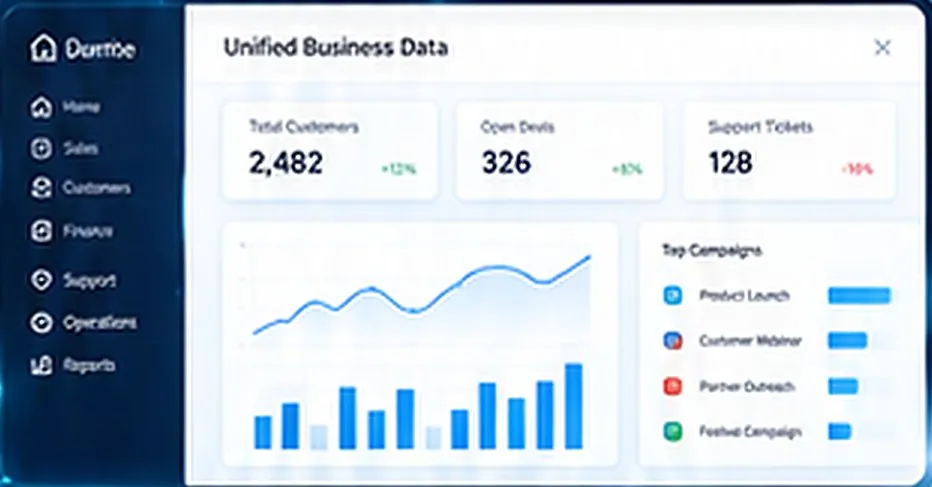
Tableau helps increase sales by showing sales leaders and reps exactly where revenue is won and lost: which deals are at risk, which sources produce the best customers, which products sell together and where the forecast is unrealistic. Connected to Salesforce, it combines CRM data with finance, marketing, product and support data that standard Salesforce reports cannot easily join. The newest versions, Tableau Next and Tableau Agent, add AI that answers questions in plain language and flags changes before someone has to look for them. This guide explains how to use it well.
Tableau options in 2026
- Tableau Cloud: Salesforce's hosted version of Tableau for building and sharing dashboards.
- Tableau Server: the self-hosted option for organizations that must run analytics in their own environment.
- Tableau Next: Salesforce's agentic analytics platform built on the Salesforce platform, with a shared semantic layer (Tableau Semantics) and AI agents. At Tableau Conference 2026 Salesforce announced agents such as Concierge for natural-language questions and Inspector for monitoring and anomaly alerts, several of them in preview.
- Tableau Agent: AI assistance for asking questions and building visualizations in plain language.
Salesforce also keeps CRM Analytics (formerly Tableau CRM) for analytics embedded inside Salesforce records. Which option fits depends on where your data lives and who will use the dashboards; check current editions and licences with Salesforce before you buy.
Six Tableau dashboards that help sell more
- Pipeline health: pipeline by stage, age and owner, with deals that have not moved in 30 days highlighted.
- Forecast accuracy: committed versus actual by rep and quarter, so leaders can coach on realistic forecasting.
- Win-loss analysis: win rate by industry, deal size, competitor, lead source and sales cycle length.
- Marketing to revenue: which campaigns and channels create opportunities that actually close, not just leads.
- Customer growth: cross-sell and upsell opportunities based on what similar customers already buy.
- Churn risk: renewals combined with support cases, product usage and payment data to flag at-risk accounts early.
How to roll out Tableau with Salesforce
- Define the metrics first: agree what counts as pipeline, a qualified opportunity, a win and churn. A semantic layer, such as Tableau Semantics or published data sources, keeps those definitions consistent.
- Fix CRM data quality: missing close dates, stale stages and empty loss reasons make every dashboard misleading. Add validation rules and required fields in Salesforce.
- Connect other sources: finance or ERP for revenue, product usage, support and marketing data, through Data Cloud, MuleSoft or native connectors.
- Apply security: row-level security so reps see their own data and managers see their team.
- Put insights where people work: embed dashboards in Salesforce pages, and send alerts to Slack or Microsoft Teams.
- Train and review: a short weekly pipeline review that uses the dashboard is the best adoption plan.
Using AI analytics safely
Natural-language questions and automatic alerts are useful, but AI answers are only as good as the definitions underneath. Make sure agents use governed metrics, check answers against known numbers in the first weeks, and limit what data each user and agent can reach. AI should speed up questions, not create a second version of the truth.
Common mistakes
- Recreating every old spreadsheet as a dashboard instead of designing for decisions.
- Building dashboards on dirty CRM data and losing the sales team's trust in week one.
- Different teams defining revenue or pipeline differently.
- Dashboards nobody opens because they live outside Salesforce and Slack.
Frequently asked questions
Can Tableau increase sales?
Tableau does not sell by itself, but it shows where revenue is won and lost. Sales teams use it to focus on the right deals, improve forecasts, fix weak lead sources and spot cross-sell and churn risks earlier.
What is the difference between Tableau and Salesforce reports?
Salesforce reports are great for data inside Salesforce. Tableau handles larger data sets, combines Salesforce with other systems and offers richer visual analysis and AI-driven analytics.
What is Tableau Next?
Tableau Next is Salesforce's agentic analytics platform, built on the Salesforce platform with a shared semantic layer and AI agents that answer questions and monitor data.
Do I need Data Cloud for Tableau?
Not for Tableau Cloud or Tableau Server, which connect to many sources directly. Tableau Next is built on the Salesforce platform and its data services.
Can Quant Tech build Tableau dashboards for Salesforce?
Yes. Quant Tech connects Salesforce and other systems to Tableau, defines metrics, sets up security and builds sales, marketing and service dashboards.
Want a pipeline dashboard your sales team actually uses? Talk to Quant Tech. We will review your Salesforce data, agree the metrics with your leaders and build the first Tableau dashboards that drive weekly decisions.
Talk to a Salesforce, HubSpot or Zoho expert—free 30-minute consultation.